In this article i will show you how to Bind Data in Pie chart Control in ASP.net 4.
Step 1
Download Northwind database from the following link.
http://www.microsoft.com/downloads/details.aspx?FamilyID=06616212-0356-46a0-8da2-eebc53a68034&displaylang=en
Step 2
Attach a Northwind database into MS-SQL server.
Step 3
Create a Web application and give the solution name as SolPieChart_ASP_4.
Step 4
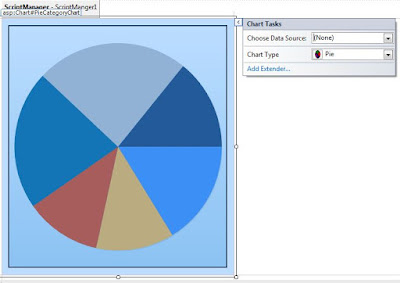
Drag the chart control from the toolbox to the page and Expanding the Chart control smart tag,select the Chart type as Pie.it is look like this

Click on Image for better view.
Click on Image for better view.
Note : ASP.net 3.5 Developers
There is no built in Chart control in ASP.net 3.5
Download Microsoft Chart Control for ASP.NET 3.5 from the following Link
http://www.microsoft.com/downloads/details.aspx?FamilyID=130f7986-bf49-4fe5-9ca8-910ae6ea442c&DisplayLang=en
Once you have installed the chart control on your machine, you are ready to use the Chart control in your application.
Chart Control DLL Path
C:\Program Files\Microsoft Chart Controls\Assemblies
Add the following chart related .NET assemblies in your website bin directory so simply copy these two assemblies from the above location to your project bin directory.
System.Web.DataVisualization.dll
System.Web.DataVisualization.Design.dll


Step 6
Finally we need to configure some of the properties of the Chart control.it is look like this
Full .ASPX Code
Step 7
Now in Code behind write a two methods for retrieving count the number of product and bind a result set into chart control,it is look like this
Run the Project
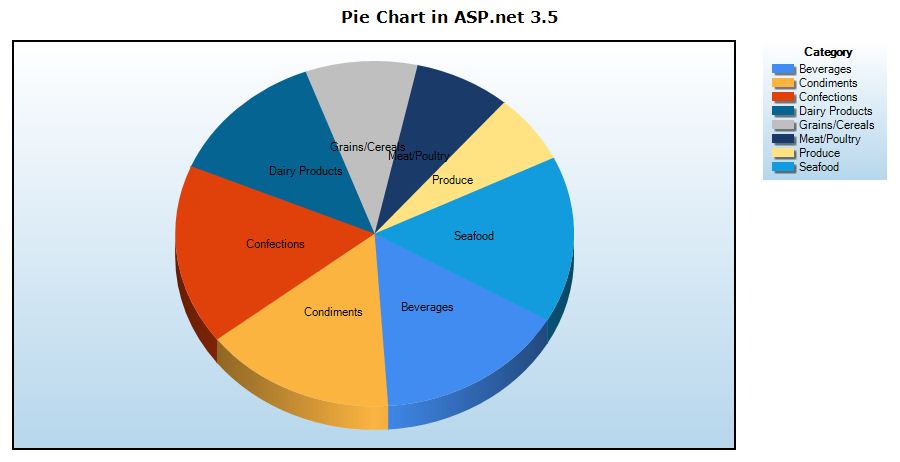
Output
4.0

Click on Image for better view.
3.5

Click on Image for better view.
Download
Pie Chart ASP.net 4.0
Pie Chart ASP.net 3.5
Step 1
Download Northwind database from the following link.
http://www.microsoft.com/downloads/details.aspx?FamilyID=06616212-0356-46a0-8da2-eebc53a68034&displaylang=en
Step 2
Attach a Northwind database into MS-SQL server.
Step 3
Create a Web application and give the solution name as SolPieChart_ASP_4.
Step 4
Drag the chart control from the toolbox to the page and Expanding the Chart control smart tag,select the Chart type as Pie.it is look like this

Click on Image for better view.

Click on Image for better view.
Note : ASP.net 3.5 Developers
There is no built in Chart control in ASP.net 3.5
Download Microsoft Chart Control for ASP.NET 3.5 from the following Link
http://www.microsoft.com/downloads/details.aspx?FamilyID=130f7986-bf49-4fe5-9ca8-910ae6ea442c&DisplayLang=en
Once you have installed the chart control on your machine, you are ready to use the Chart control in your application.
Chart Control DLL Path
C:\Program Files\Microsoft Chart Controls\Assemblies
Add the following chart related .NET assemblies in your website bin directory so simply copy these two assemblies from the above location to your project bin directory.
System.Web.DataVisualization.dll
System.Web.DataVisualization.Design.dll
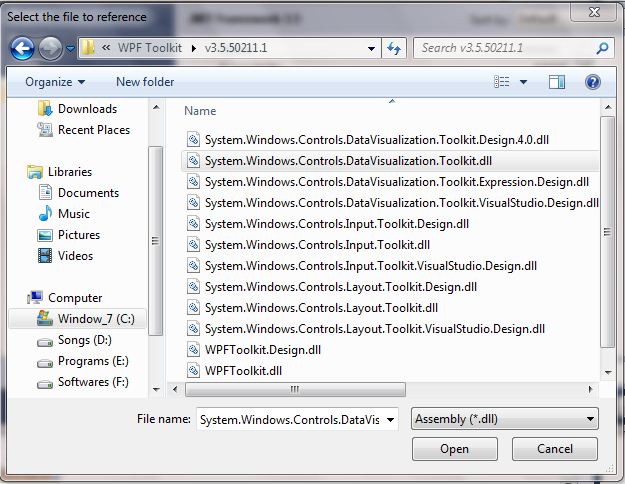
Click on Image for better view.
If you want to use Microsoft Chart control by simply dragging and dropping on the web page, I will recommend you to add Chart control to the toolbox. For doing this, Right Click in toolbox click Choose Items option and browse and select the System.Web.DataVisualization.dll.

Click on Image for better view.
Drag the chart control from the toolbox to the page.
Step 5
Create a Stored Procedure that we fetch count the number of products in each category table in the database so we can bind these data into Pie Chart Control,it is look like this
CREATE PROCEDURE SpProductCount
AS

SELECT Categories.CategoryName,COUNT(*) as 'ProductCount'
	FROM Products
		INNER JOIN
			Categories
				ON
					Products.CategoryID=Categories.CategoryID

					GROUP BY Categories.CategoryName
					ORDER BY Categories.CategoryName ASC
GO
Step 6
Finally we need to configure some of the properties of the Chart control.it is look like this
<asp:Chart ID="PieCategoryChart" runat="server"  Height="471px" Width="931px">

                     <Titles>
                          <asp:Title Name="Title1" Text="Pie Chart in ASP.net 4"
                             Alignment="TopCenter" Font="Verdana, 12pt, style=Bold">
                          </asp:Title>
                    </Titles>

                    <series>
                        <asp:Series ChartType="Pie" Name="PieSeries"
                        XValueMember="CategoryName" YValueMembers="ProductCount"
                        ChartArea="ChartArea1" Legend="Legend1" ShadowOffset="2"
                        ToolTip="CategoryName :#VALX \nProductCount : #VALY">
                        </asp:Series>
                    </series>

                    <chartareas>
                         <asp:ChartArea Name="ChartArea1" BackGradientStyle="TopBottom" Area3DStyle-Enable3D="true"
                            BackSecondaryColor="#B6D6EC" BorderDashStyle="Solid" BorderWidth="2">
                            <AxisX>
                                <MajorGrid Enabled="False" />
                            </AxisX>
                        </asp:ChartArea>
                    </chartareas>

                    <Legends>
                        <asp:Legend Name="Legend1" Title="Category" LegendStyle="Table" TableStyle="Tall"  BackGradientStyle="TopBottom"
                            BackSecondaryColor="#B6D6EC" BorderDashStyle="Solid" BorderWidth="2" >
                        </asp:Legend>
                    </Legends>

                </asp:Chart>
Full .ASPX Code
<%@ Page Language="C#" AutoEventWireup="true" CodeFile="Default.aspx.cs" Inherits="_Default" %>

<%@ Register assembly="System.Web.DataVisualization, Version=4.0.0.0, Culture=neutral, PublicKeyToken=31bf3856ad364e35" namespace="System.Web.UI.DataVisualization.Charting" tagprefix="asp" %>

<!DOCTYPE html PUBLIC "-//W3C//DTD XHTML 1.0 Transitional//EN" "http://www.w3.org/TR/xhtml1/DTD/xhtml1-transitional.dtd">

<html xmlns="http://www.w3.org/1999/xhtml">
<head runat="server">
    <title></title>
</head>
<body>
    <form id="form1" runat="server">
    <div>

        <asp:ScriptManager ID="ScriptManger1" runat="server">
        </asp:ScriptManager>

        <asp:UpdatePanel ID="UpdatePanel1" runat="server">
            <ContentTemplate>


                <asp:Chart ID="PieCategoryChart" runat="server"  Height="471px" Width="931px">

                     <Titles>
                          <asp:Title Name="Title1" Text="Pie Chart in ASP.net 4"
                             Alignment="TopCenter" Font="Verdana, 12pt, style=Bold">
                          </asp:Title>
                    </Titles>

                    <series>
                        <asp:Series ChartType="Pie" Name="PieSeries"
                        XValueMember="CategoryName" YValueMembers="ProductCount"
                        ChartArea="ChartArea1" Legend="Legend1" ShadowOffset="2"
                        ToolTip="CategoryName :#VALX \nProductCount : #VALY">
                        </asp:Series>
                    </series>

                    <chartareas>
                         <asp:ChartArea Name="ChartArea1" BackGradientStyle="TopBottom" Area3DStyle-Enable3D="true"
                            BackSecondaryColor="#B6D6EC" BorderDashStyle="Solid" BorderWidth="2">
                            <AxisX>
                                <MajorGrid Enabled="False" />
                            </AxisX>
                        </asp:ChartArea>
                    </chartareas>

                    <Legends>
                        <asp:Legend Name="Legend1" Title="Category" LegendStyle="Table" TableStyle="Tall"  BackGradientStyle="TopBottom"
                            BackSecondaryColor="#B6D6EC" BorderDashStyle="Solid" BorderWidth="2" >
                        </asp:Legend>
                    </Legends>

                </asp:Chart>


            </ContentTemplate>
        </asp:UpdatePanel>


    </div>
    </form>
</body>
</html>
Step 7
Now in Code behind write a two methods for retrieving count the number of product and bind a result set into chart control,it is look like this
using System;
using System.Collections.Generic;
using System.Linq;
using System.Web;
using System.Web.UI;
using System.Web.UI.WebControls;
using System.Data.SqlClient;
using System.Data;

public partial class _Default : System.Web.UI.Page
{
    protected void Page_Load(object sender, EventArgs e)
    {
        if (IsPostBack == false)
        {
            try
            {
                BindChart();
            }
            catch (Exception)
            { }
        }
    }

    #region Methods

    ///
    /// Get Customers Data from the Nortwind Database
    ///
    /// DataTable
    private DataTable  GetProductCountData()
    {
        try
        {
            SqlConnection SqlCon = new SqlConnection(@"Data Source=SHREE\SHREE;Initial Catalog=Northwind;Integrated Security=True");
            SqlCon.Open();

            SqlCommand SqlComm = new SqlCommand();
            SqlComm.Connection = SqlCon;
            SqlComm.CommandType = CommandType.StoredProcedure;
            SqlComm.CommandText = "SpProductCount";

            DataTable Table = new DataTable();

            SqlDataAdapter SqlDa = new SqlDataAdapter(SqlComm);
            SqlDa.Fill(Table);

            return Table;
        }
        catch (Exception ex)
        {
            throw new Exception(ex.Message);
        }
    }

    ///
    ///  Bind Customers Data into Pie Chart
    ///
    private void BindChart()
    {
        try
        {
            DataTable Table = GetProductCountData();

            if (Table != null)
            {
                if (Table.Rows.Count > 0)
                {
                    PieCategoryChart.DataSource = Table;
                    PieCategoryChart.DataBind();
                }
            }
        }
        catch (Exception ex)
        {
            throw new Exception(ex.Message);
        }
    }

    #endregion
}
Run the Project
Output
4.0

Click on Image for better view.
3.5
Click on Image for better view.
Download
Pie Chart ASP.net 4.0
Pie Chart ASP.net 3.5